· Casper van Elteren · Programming · 7 min read
From Zero to 25K Downloads: What I Learned Developing a FOSS Project
Lessons learned from 6 months of FOSS development
This year has been a whirlwind of developments: In particular, I have taken over the development of Proplot under a new name, UltraPlot. We recently reached the first 100 stars (and over 25k downloads!) which is a small milestone in the grand scheme of things, but it feels like a good time to reflect on the journey so far.
What is UltraPlot?
UltraPlot is a succint wrapper around matplotlib that aims to make (scientific) plotting easier and more intuitive. It differs from other libraries such as seaborn, or datashader in that it provides a unique and stylish style that is closer to matplotlib while provding a lot of quality of life improvements. It is designed to be easy to use, while still providing a lot of flexibility and power. The goal is to make plotting in Python more enjoyable and less frustrating. And for the geoscientists out there, it also provides a lot of functionality for plotting geospatial data out of the box!
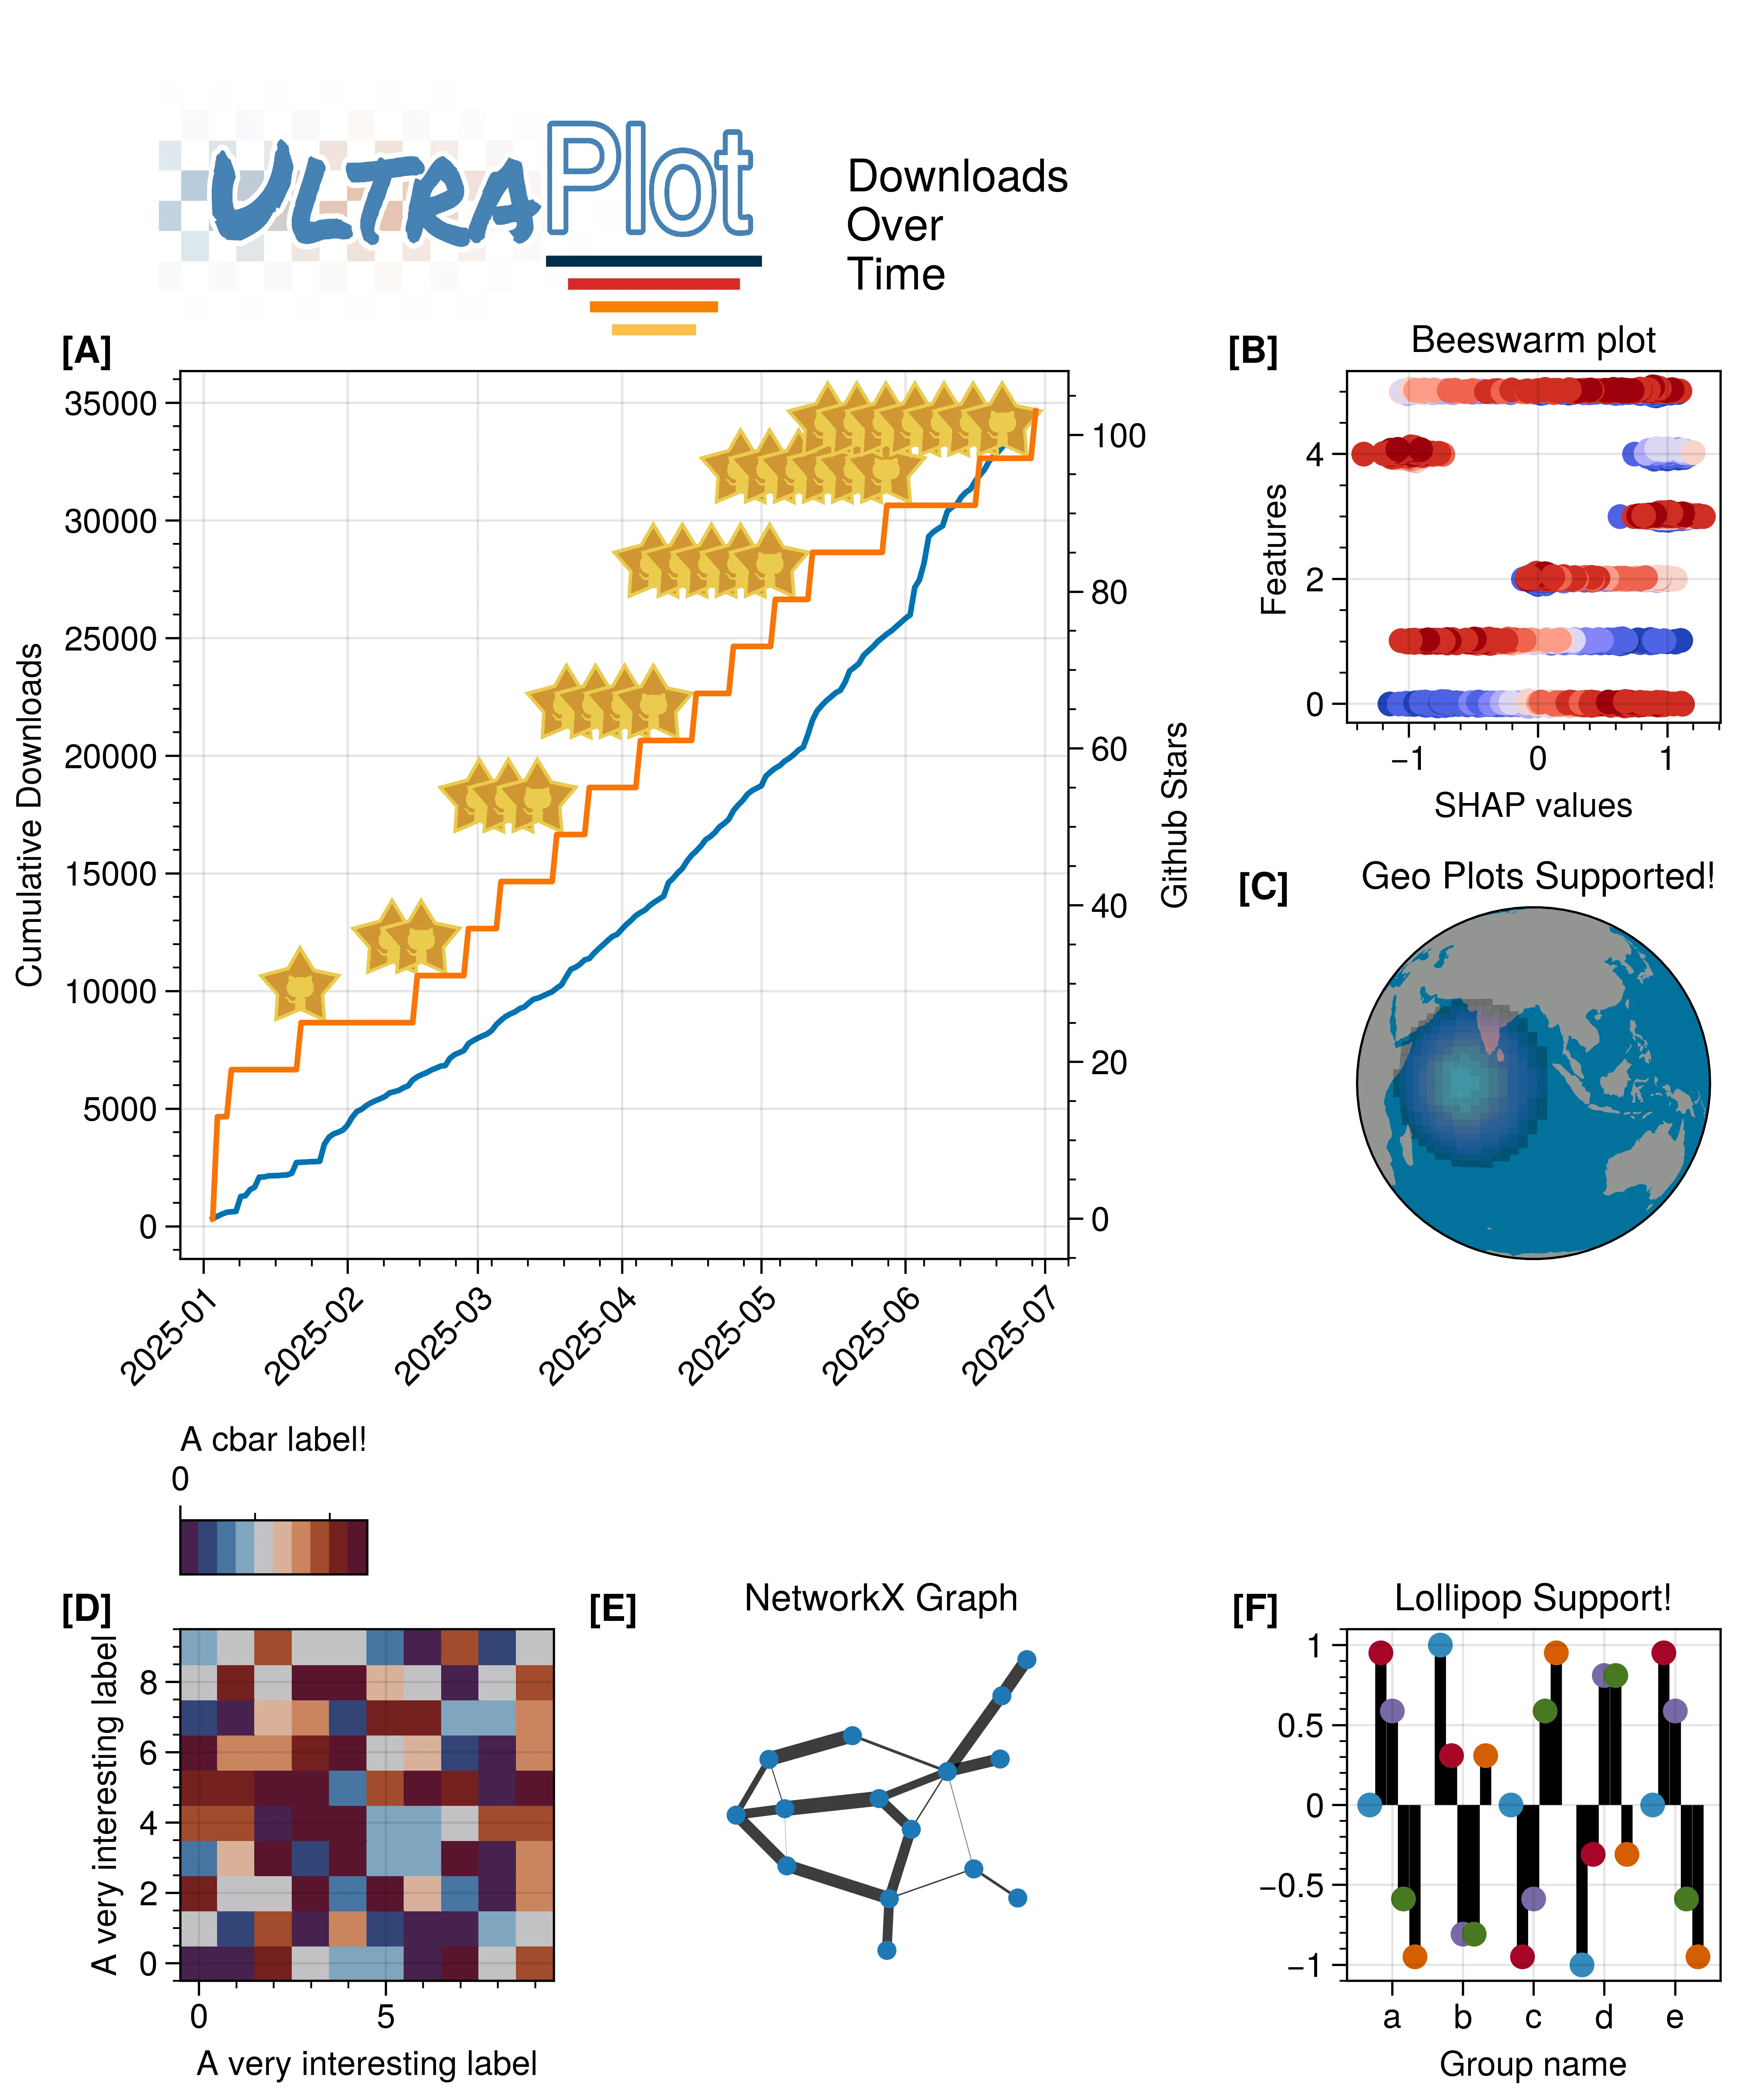
Figure 1. A demo showcasing the capabilities of UltraPlot. We went from 0 stars and 1 user (me) to over 25k downloads, and 103 stars in just six months. The project has grown rapidly (at least for me ;-)!)
Concrete example
Imagine I am about to submit my first paper, and I need to make a figure that shows the relationship between two variables, a network, a bar chart, a heatmap, and a globe. I could use matplotlib to create a scatter plot, but it would take a lot of code to get the figure looking the way I want it. With UltraPlot, I can create the same figure with just a few lines of code, and it will look great out of the box.
import ultraplot as uplt, numpy as np
layout = [
  [1, 1, 2,],
  [1, 1, 3],
  [4, 5, 6],
] # define any arbitrary layout

# We can style targetting a journal directly from
# the layout definition
fig, axs = uplt.subplots(layout, journal = "nat2", share = 0,
)
ax.format(abc = "[A]", abcloc = "outer left") # nature style subplot labeling
What have I learned?
Writing code is not only about writing code. In the end the piece of software you create is meant to be used by others. I would therefore put this on the top of my list of lessons learned:
Communication is key. Be it with users using your software, or communicating with other developers. It is not easy to communicate your ideas and often what you think is clear is not to others. I have learned to be more explicit with my communication. This requires me to put more effort in drafting a response, or spelling out the steps necessary to reach a conclusion in my head. I have also learned to be more patient with others, and to ask for clarification when I do not understand something. This has helped me to become a better developer and to create better software.
Documentation is essential. I have learned that good documentation is crucial for the success of a project. It helps users to understand how to use the software, and it helps developers to understand how to contribute. I have also learned that documentation is not just about writing code comments, but also about writing tutorials, examples, and guides. Good documentation can make the difference between a successful project and a failed one. UltraPlot builds on the shoulders of giants (proplot), and inherited the great tutorials written by Luke Davis. Over the past six months I had to not only write documentation for the backend, and user targetted functions, but also new tutorials such as the recently added network plotting.
Test, test test. Writing unittest is sometimes boring work, but it is essential to have the confidence to introduce new features or make changes to the codebase. I have learned that writing tests is not just about testing the code, but also about testing the functionality and the user experience. It is important to test the software from the user’s perspective, and to make sure that it works as expected. This has helped me to catch bugs early and to improve the quality of the software. UltraPlot started out without any tests, and I have added over 4000 lines of pure testing code in the past six months. This has helped me to catch bugs early and to improve the quality of the software.
Think twice, write once. To maintain a codebase, you wish to minimize the refactors necessary to maintain it. As such when writing code, we aim to maximize testability. This will naturally yield functions that are small and self-contained. Unfortunately, UltraPlot is not at this stage yet, but newly added code is written with this in mind. I attempt to write once, or refactor once and then leave it be. This keeps your mind moving forward and the process ensures modularity and testability. It is also important to keep the codebase clean and organized, so that it is easy to navigate and understand. This has helped me to maintain the codebase and to make it easier for others to contribute.
Simplify, rather than complicate. When writing code, we can have a sick one-liner that does something very intricate, but it is often better to write code that is simple and easy to understand. This makes it easier to maintain and to debug. In UltraPlot’s development cycle, I aim to write code that is easy to write for a human not a computer. This means that I try to avoid complex one-liners and instead write code that is easy to read and understand. This has helped me to create a codebase that is easier to maintain and to debug.
Outro: Reflections
I was rather surprised to learn that we had over 25k downloads in the first six months. Every star that was added to the repository felt like a small victory, and it motivated me to keep going. But beyond the numbers, I was equally surprised by how much I learned in such a short time.
Although I have been programming for a long time, maintaining an open-source project used by others is fundamentally different. When you’re writing code just for yourself, you can take shortcuts, use cryptic variable names, or leave functions undocumented. But when thousands of people depend on your code, every design decision matters. You start thinking not just about whether something works, but whether it will still work six months from now when someone else needs to modify it, or whether a new user can understand it without spending hours deciphering your logic.
The responsibility felt both exciting and daunting. Each GitHub issue represented a real person trying to solve a real problem with their research or work. When someone reported a bug, it wasn’t just a technical challenge—it was potentially blocking their progress on a paper deadline or a crucial analysis. This shifted my perspective from “does this code work?” to “does this code serve its users well?” Perhaps most surprisingly, I discovered that the technical challenges often took a backseat to the human ones. Writing efficient algorithms was familiar territory, but learning to write clear issue responses, anticipating user confusion in documentation, and designing APIs that felt intuitive rather than just functional—these were entirely new skills that proved just as important as the code itself.
I am excited to see where UltraPlot will go in the future. The community that has formed around the project continues to surprise me with creative use cases I never anticipated, and their feedback keeps pushing the library in directions I wouldn’t have considered on my own. I hope that it will continue to grow and improve, not just in features, but in its ability to make the daily work of researchers and data scientists a little bit easier and more enjoyable.