A friendly ghost for all your computational needs
Casper van Elteren
I study how complex systems work and how we can intervene in them. I build scientific software and visualizations to explore those questions and share what I find.
My interests are broad, and I often get distracted. That takes me between research, programming, visualization, and making things I can use away from the computer.
Working with complex systems
I work with computational models, networks, and information theory to study how changes in one part of a system affect the rest. I am interested in what this can tell us about where and how to intervene, including when those interventions inform policy.
At the Institute for Advanced Study in Amsterdam, I worked on identifying driver nodes in dynamic networks using information theory. I also served on its Board of Associates, helping advise on the direction of the institute.
Criminal networks
I study how criminal organizations form and why they can be difficult to disrupt once established. In our models, people with different roles weigh the costs and benefits of participating. Their decisions can sustain an organization even under conditions that would have prevented it from forming in the first place. This dependence on history is called hysteresis: reversing the conditions does not necessarily reverse the outcome.
The same conditions can support two different outcomes.
The original figure and the illustrative model
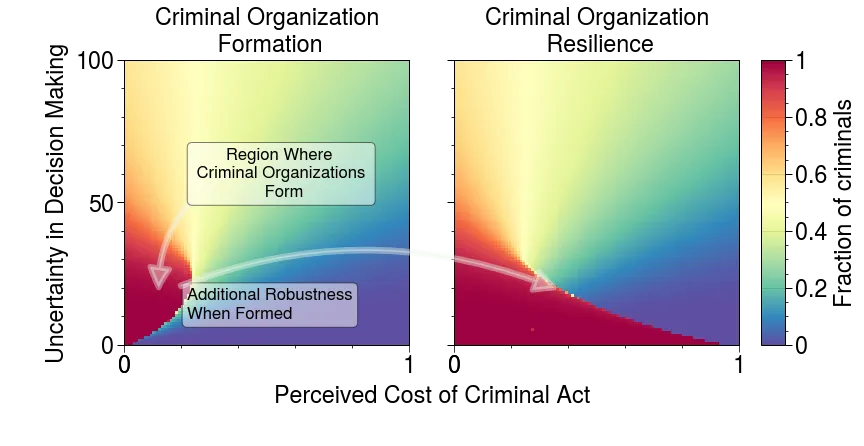
The original figure compares different initial conditions over cost and uncertainty. The interactive above holds uncertainty fixed and uses a mean-field illustration: dx/dt = σ((x² − c) / 0.06) − x, where σ is the logistic function, x is the active fraction, and benefits are normalized to one. The x² term represents needing two other active roles. At each cost, trajectories are settled from x = 0.001 and x = 0.999. Parameters are illustrative; no values were digitized from the figure.
Original figure: van Elteren, Vasconcelos & Lees, Scientific Reports 14, 17678 (2024), doi:10.1038/s41598-024-68445-0.
I wrote about these results in The surprising resilience of criminal organizations. There is also an interactive crime model where you can explore how changes in costs, uncertainty, and punishment affect collective behaviour.
Tipping points
I am also interested in changes that continue after an intervention ends. For example, a temporary subsidy might help a new energy technology become widely used. But knowing that adoption increased does not tell us what kept it going: falling costs, coordination between adopters, or experience spreading through a network could produce similar outcomes.
I use landscapes to explore that distinction. The question is which process changed the system, and how small an intervention can be while still allowing the change to continue on its own.
Try a small push, then a larger one. Does the change last?
What this landscape represents
The illustrative potential is V(x; h) = x⁴/4 − x²/2 − hx, with motion dx/dt = −∂V/∂x. The slider changes h; the push buttons displace x by 0.45 or 1.35 toward the alternative state. Neither axis is calibrated to an energy technology or a measured population. A valley represents a stable pattern, not a particular mechanism. This is a new schematic, not a reconstruction of a published figure.
Antarctic governance
More recently, I have been studying the Antarctic Treaty System. There, the interactions are between people and institutions: what participants pay attention to, how decisions connect to earlier decisions, and what it means when nobody objects to a proposal.
What participants work on together
This network comes from that research. Each dot is a concern raised at Antarctic treaty meetings. Concerns are connected when the same participants tend to specialise in both. Reading those connections gives us a way to study how attention moves through the system.
Hover or focus a concern for its name. Select it to explore its connections, or highlight a region of related work.
45 concerns; links describe shared specialisation. Colours show regions of related work.
There is more about this work on the research page, along with my publications.
Building the tools
Research also means spending a lot of time with software. I maintain UltraPlot, a wrapper for matplotlib, and have contributed to matplotlib, micromamba, NetworkX, igraph, and other projects in the scientific stack. I like working on tools that other people can use in their own research.
My work moves between Python, Nim, C++, JavaScript, Julia, and R. Combining languages lets me keep the parts that are easy to explore while making expensive computations faster. Choosing the tools is part of working out the problem.
Figures and explanations take just as much care. I give lectures for scientific and non-scientific audiences, including through Applied Complexity, and have taught for the RIVM and Commenius College. Explaining a model to someone who does not work with it often helps me see what I have left unclear.
Away from the screen
I make furniture and work on 3D printing models. I enjoy having something I can touch and use after working through an idea. I also write about topics that catch my attention; the subjects vary as much as my interests do.
If you would like to talk about any of this, get in touch.