Appendix E
How Could Form and Function Co-evolve?
Connection to Existing Literature
There are three studies that looked at the effect of law enforcement strategies on the disruption of criminal organization. This inherently creates a tension between two different forces; the ability to adapt to an external stressor.
In these studies, interventions are operationalized by performing a structural edit on the graph and then simulating how the remaining in the agents replace or reconnect to remain operations. They do not model the co-evolution of criminals embedded within a social network and implicit economic market.
Carley and Tsvetovat
The duo published a series of articles on covert networks [252], [253]. The topic of these papers involves building complex agent based models that could emulate the behavior or terrorist and criminal organization. By including a limited internal state, agents make rational decisions on bounded information. The performance of an organization to carry out an illicit task is often the focus of study while another explicitly modeled law enforcement organization aims to prevent the clandestine organization to carry out their task.
The Relative Inefectiveness of Criminal Disruption
Duijn and colleagues studied the effect of network centrality driven interventions and the ability for a criminal network to rewire after intervention [132]. Different recovery mechanisms were studied in which the agents connected to a removed individual would need to find a replacement through their social network. Preference was given to, for example, degree, social distance, or randomly from a set of candidates. The results implied that the average shortest path length between individual reduces after intervention. This is expected since the rewiring strategies are likely to connect individuals that are further apart and ensures that the network remains connected.
Criminal Network Vulnerabilities and Adaptations
Considered the effect of criminal network adaptation after law enforcement. Interventions were performed on a known graph by emulating law enforcement intervention based on structural features of the networks (degree centrality, betweenness centrality, and minimum cut) [207]. The effect of intervention were studied with and without the ability for the network to adapt. Adaption occurred by considering potential candidates possessing the right skill to complete the supply chain for producing a drug.
Cost-benefit Modeling and Evolutionary Dynamics
Matjaž Perc’s research has significantly advanced the scientific understanding of criminal behavior through complex systems and network analysis [140], [145]. His studies revealed that criminal activities exhibit clustering patterns with a small-world network structure, facilitating the rapid spread of criminal behavior and making the network robust against random disruptions but vulnerable to targeted attacks. Additionally, Perc used agent-based models to show how environmental factors, such as socioeconomic conditions and law enforcement policies, influence the formation and sustainability of criminal organizations. These findings underscore the importance of viewing criminal behavior as a complex adaptive system, advocating for a holistic approach to crime prevention and intervention that considers the dynamic interactions within criminal networks and their environments.
Loss of Access to Global Information Reduces Temporal Fluctuations
In the model, the mixing parameter , controls the extent to which agents can interact with other individuals. With probability , agents consider connecting with any other individual in the system with probability . Here, we examine the effect on system dynamics when agents lose this ability and instead only consider connecting to neighbors of their neighbors, thus constraining the potential network structure.
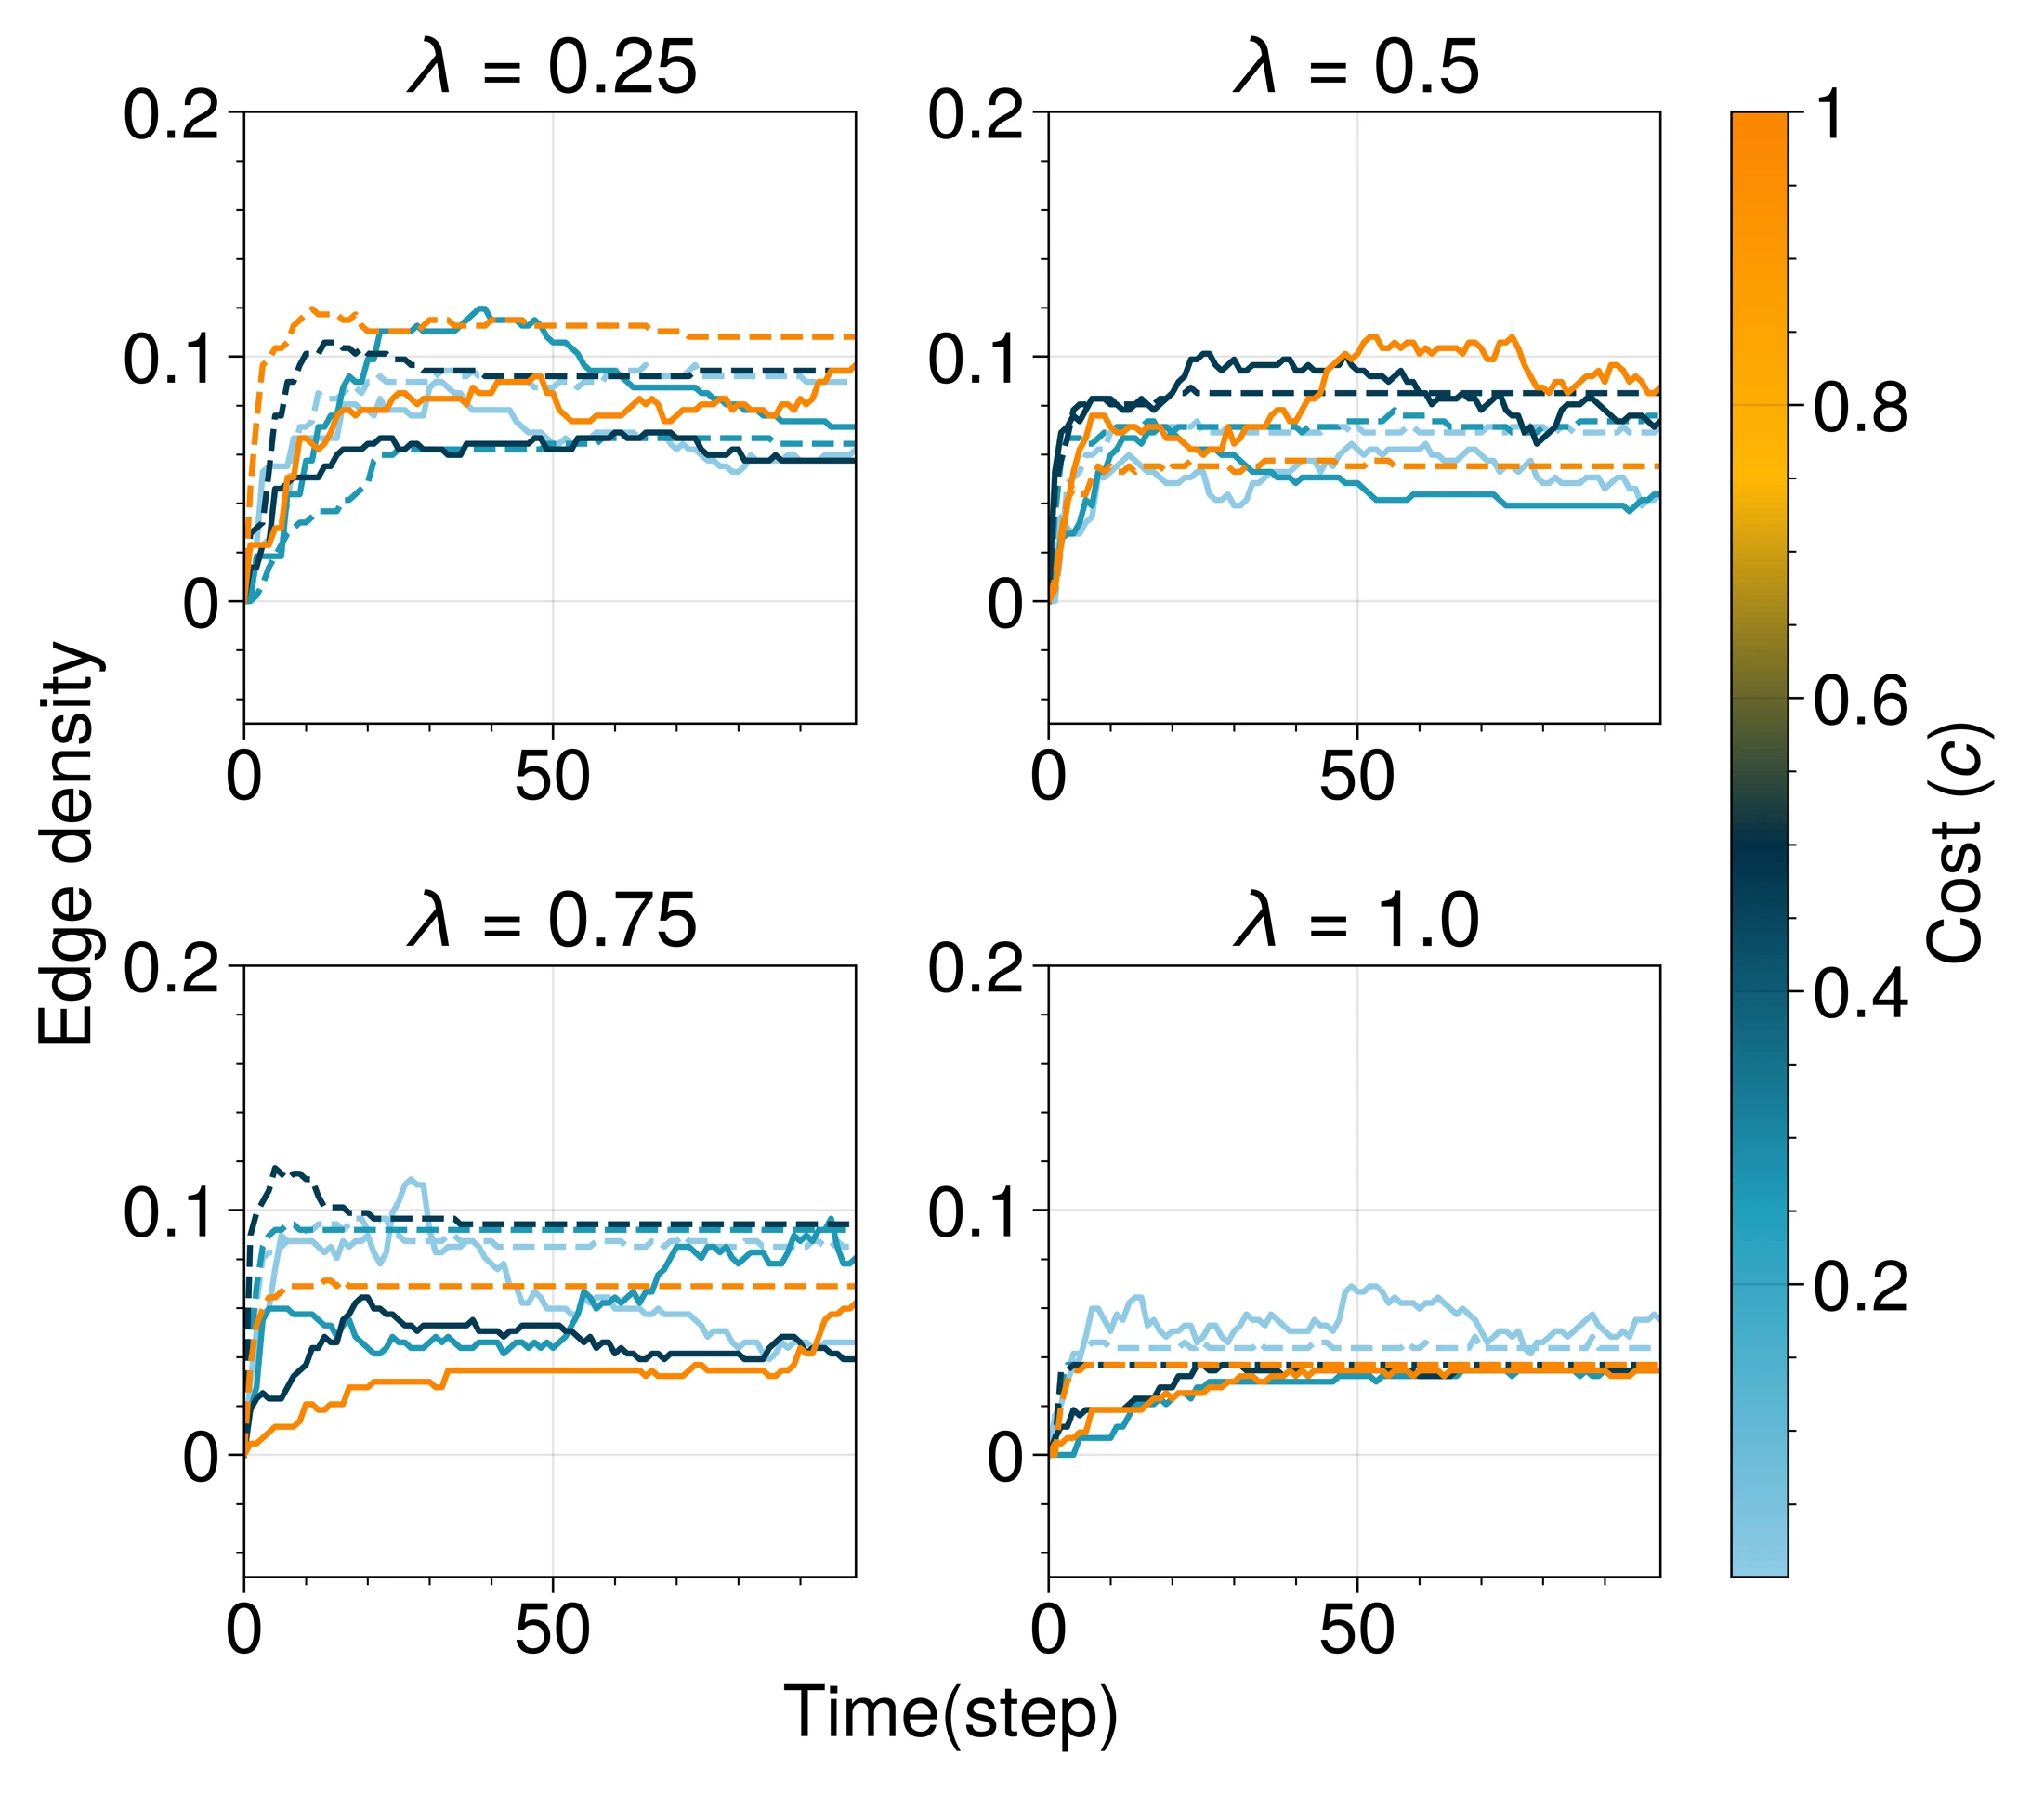
The system dynamics are evaluated until equilibrium is reached while agents have access to all other agents (). Then, agents either retain this access or are restricted to connecting only with neighbors of neighbors. The results show that limiting agents to local information reduces temporal fluctuations in edge density (Figure E.I.1).
The findings indicate that access to global information introduces some noise in the edge dynamics. This suggests that while the system can reach a stable point (as shown in Figure 5.3, Figure 5.4, Figure 5.5), this global access is not necessary to maintain stability. Instead, it causes minor fluctuations over time.
Methods & Data
The model presented here, is an extension of a previous study using fixed graphs. In contrast to that study, we innovate by allowing agents to adjust their connections over time by adding a new rewiring parameter . Furthermore, we used a different sampling technique that is more common in evolutionary game theory. What follows is an in depth description of the model and the data used to generate the results presented in the main text.
Modeling Criminal organizations as a Complex Adaptive System
At its core, we assume that a potential criminal actor performs a cost-benefit analysis before committing a criminal act. The potential benefits could include financial gain, enhanced reputation, or the thrill of the act. In contrast, costs are associated with the risk of being caught or imprisoned. Additionally, increased criminal notoriety may result in potential harms from criminal rivalry.
To structure these dynamics, we first outline how agents consider committing a criminal act based on interactions with their nearest neighbors. Then, we describe how agents might decide to change their social networks by adding or removing connections based on their current environment.
Agent dynamics
The model assumes that criminal organizations can be considered to operate similarly to a regular business; agents aim to collaborate with other agents based on the required roles to run a business. The organization is assumed to be completed by the complete set of required roles harmoniously working together. Each agent has a state that can change based on the nearest-neighbor interactions, whereby a reward is obtained when the agents engage in criminal activity. The reward is weighed by the cost that is proportional to the visibility of an agent in the network.
Formally, the payout for a game consists of the payout of all potential unique games the focal agent can play with its nearest neighbors. The payout considers the sum of the payoff each agent in the game receives. The payoff for agent is given by:
(E.1) where represents all organizations agent could form with its nearest neighbors and their neighbors, is the set of all roles required to form a complete organization, is the state of agent in organization having role , is the cost of being visible in the network.
The potential benefit derived from being part of an organization follows a “birthday party dynamic" in which the focal agent being updated derives payoffs from organizations formed with its immediate neighbors and the neighbors of neighbors. This results in the focal agent receiving a benefit from a potential partner that it does not directly have a connection with. Consequently, the benefit scales on the order of the average degree, that is the cumulative benefit is proportional .
The payoff represents the benefit an agent receives when it connects to a set of actors whose complementary roles enable complete operational capability. The cost is proportional to the number of organizations an agent could be part of but is only incurred when the agent is criminal. Variations of the payoff functions were explored, where the cost was proportional to the (criminal) degree, but the remaining results were similar to the ones presented here and hence will not be further reported on.
The agent considers changing their current strategy with another with probability:
(E.2) where is the decision error.
We further extend an agent’s capability by allowing the agent to update whom they are connected with. With probability , each agent can update that their connectedness. Each agent considers adding or removing an edge with another random agent: if the agent already possess and edge to the other agent, it considers removing it (and adding it vice versa). The change is accepted with probability Equation E.2.
Unless stated otherwise, the simulations were performed using agents with an equal number of agents in each role with a total of roles. Simulations were performed until the dynamics converged with an mean squared error (MSE) for the duration of time steps. After convergence, the system was sampled for an additional time steps on which the reported analyses were performed. During each simulation step, all agents were updated in random order, yielding a net update of simulation steps.
Network dynamics
The rewiring probability, , controls how often agents consider changing their strategy vs. changing their connectivity. For , agents only switch from criminal to non-criminal based on their connections and strategies, without considering the strategies of others. At the other extreme, with , agents keep their current strategy and only attempt to rewire based on the strategies of others.
In the limit as , non-criminal agents yield a payoff of 0 regardless of the strategies of others. Criminals, on the other hand, benefit from connections to other criminal actors, but incur costs proportional to their degree. The full cost is incurred only when an agent is connected to all others.
This sets up a trade-off for criminals: forming new connections can increase benefits through novel organizations, while incurring additional costs per edge. Non-criminal agents form a dynamic random network with average degree . Criminal organizations will attempt to form organizations up to in the absence of any cost associated with the criminal act. Increasing cost-to-benefit will lead to a reduction in their ability to connect to other agents.
The parameter controls the probability of agents considering connecting to a random other agent. When , agents will consider removing or adding an edge to a random agent independent of whether it is connected to it already. Conversely, if agents will only consider changing their connectivity to their neighbors or neighbors of neighbors. As , agents tend to favor connecting to neighbors of neighbors, resulting in a more localized rewiring. In the extreme case where , agents only consider adding or removing edges to their immediate neighbors and those of their neighbors.
Unless otherwise specified, we set for the remainder of the experiments. However, see the supplementary information for analysis of other values of . The main effects of varying are seen in scenarios with low decision error, where local information can reduce temporal fluctuations. In contrast, access to global information reduces the dependency on the initial network structure. As such, our analysis focuses primarily on situations where actors can interact with any other actor, assuming no restrictions on their connections.
Deriving Salient Roles from Data
The value network was created by separating the unique labels into disassortative roles. We assume that a criminal organization will aim to minimize redundancy by interacting with roles different from their own, resulting in an optimized value network. The 99 roles are separated using techniques from information theory. By leveraging ideas from natural language processing [254], we aim to extract the roles that convey the most information, i.e., are the most unique, to determine the full set of roles an individual has. In information theory terms, we seek to find the least number of yes/no questions needed to determine the full set of roles assigned to an agent starting from a given role within that subset.
We define the document as the collection of each “sentence” representing the collection of roles or “tokens” that an agent has. The salience of each token is computed as the shared information between a token and document . In other words, we can compute the shared information between the token and the document as the mutual information
where represents the entropy or uncertainty in the document and is the uncertainty in the document given token . Each agent can then be assigned by its most salient token, i.e.
The resulting data-driven value network is depicted in Figure 5.1, Figure 5.2 Using the unique labels, the network display a mostly negative assortativity for each agents ego network (Figure 5.1, Figure 5.2).
Model Calibration and Application to Dutch Criminal Networks
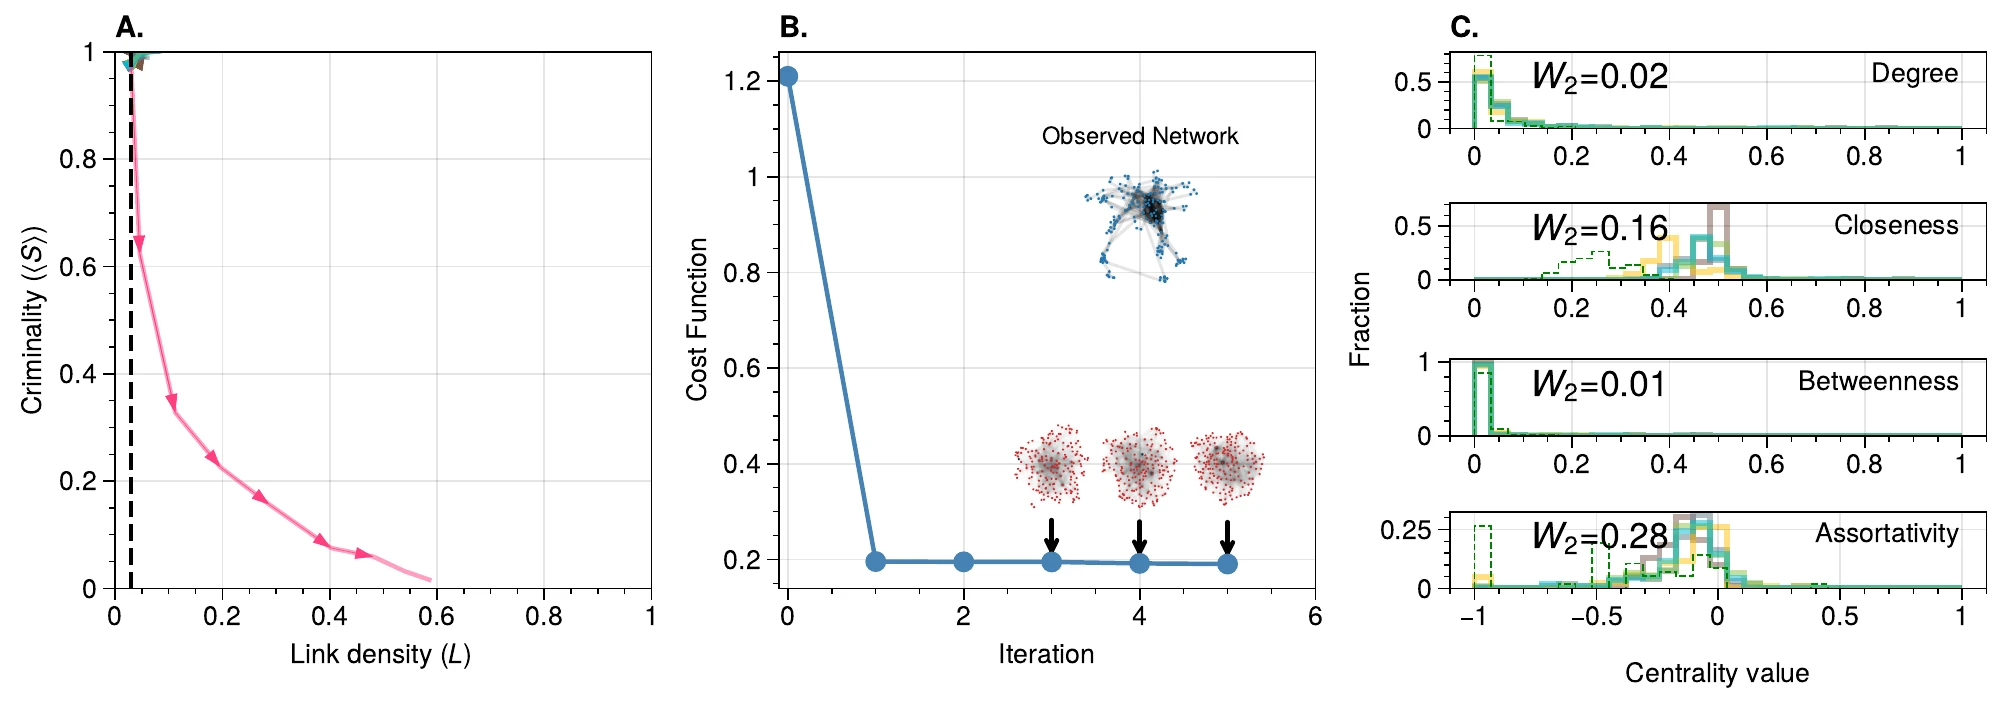
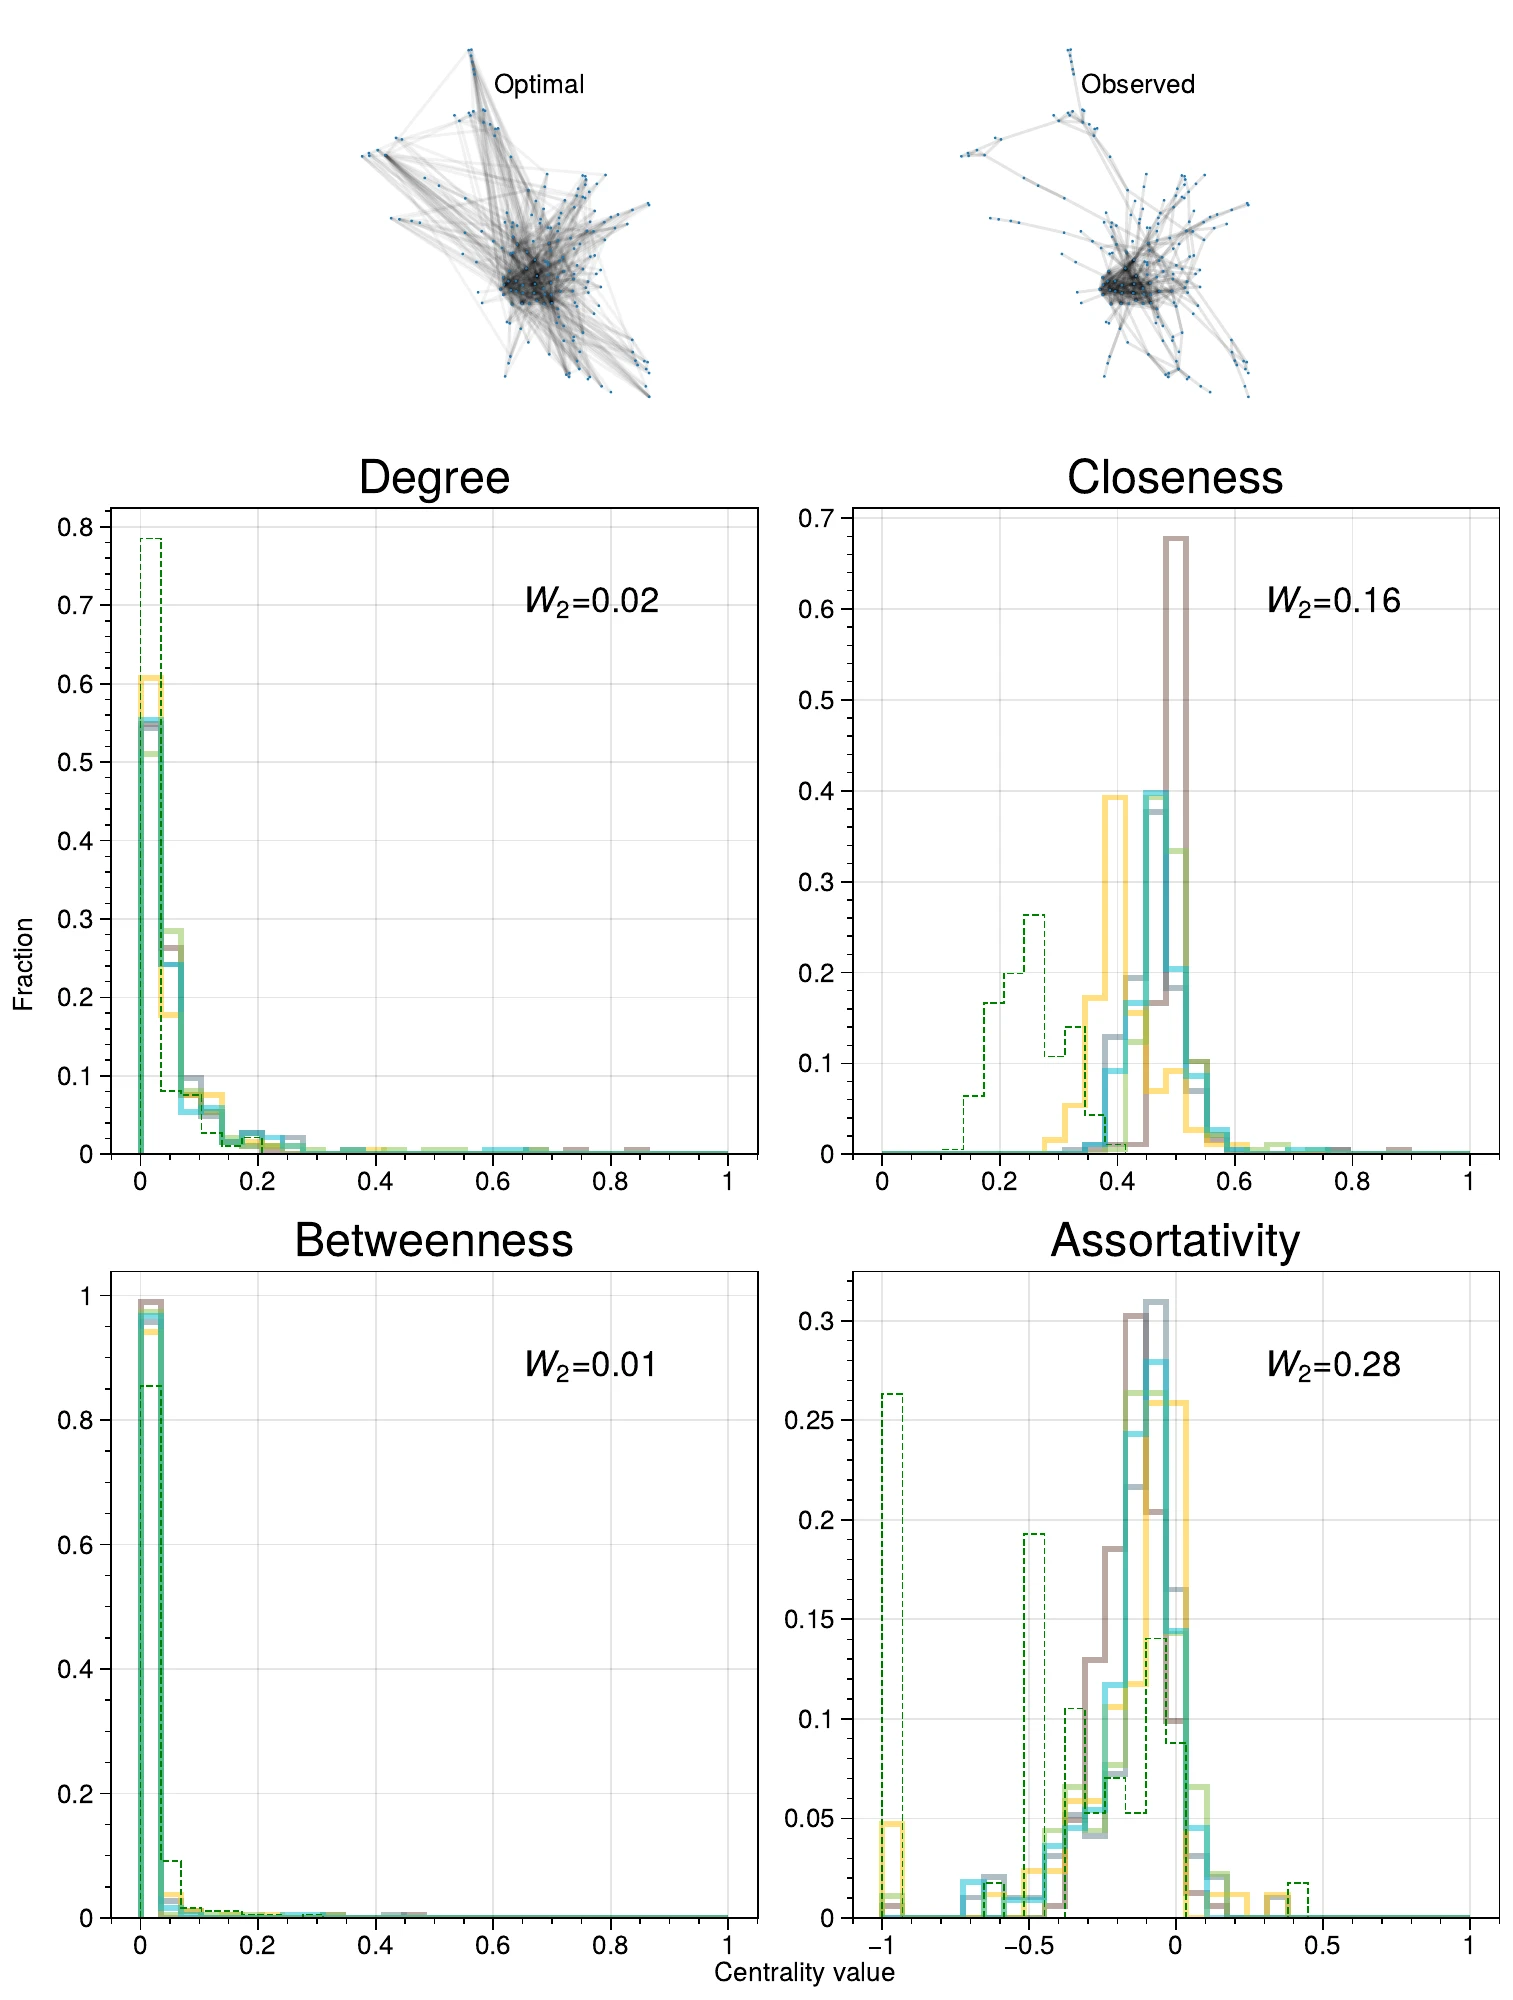
We calibrated the model’s parameters to align with Dutch criminal network data. Using simulated annealing with local gradient checking, we optimized the cost-to-benefit ratio and decision error parameters. The optimization minimized a cost function that quantified discrepancies between the model’s network properties and those observed in the data (see methods for details).
The calibrated model successfully reproduces key structural features of the Dutch criminal network. Statistical analysis confirms that the observed data falls well within the model’s predictions (), as evidenced by the right-side area under the curve.
Calibration Procedure using Simulated Annealing
We used simulated annealing to optimize the model parameters, ensuring that the model’s properties closely match empirical observations while providing insights into system responses to external perturbations. The optimization focused on two key parameters: the decision error () and the cost-to-benefit ratio (). We fixed the rewiring probability at , assuming network restructuring occurs at comparable timescales to strategy updates
The optimization procedure involved 32 independent chains, initialized across the parameter space and . Each chain was performed for iterations, with the model evaluated over timesteps per iteration and repeated times for each parameter value to provide confidence in the average cost for that parameter setting – effectively yielding a maximum likelihood estimate for the model parameters. The quality of the fit was assessed using a cost function that captures both structural and dynamical aspects of the network:
(E.5) where denotes the distance between the observed quantities (superscript ) and model-generated (superscript ) quantities: mean criminality () and elements of the adjacency matrix (). For the observed data, we assumed a baseline criminality .
The optimization procedure aimed to demonstrate that the model could successfully replicate the essential structural and dynamical characteristics found in actual criminal networks. While identifying critical features a priori presents a significant challenge, the approach leverages graph edit distance metrics on network links to extract meaningful insights. This method assumes that the observed data contains fundamental truths about the network’s structural properties.
By minimizing the distance between observed and simulated networks, we demonstrate that the model can, in principle, generate networks that closely resemble empirical data. However, discrepancies between the model-generated and observed networks may not necessarily indicate model limitations. Instead, these differences could highlight gaps in the observed data due to its inherent incompleteness. Thus, the comparison between modeled and empirical networks serves a dual purpose: it validates the model’s accuracy while simultaneously assessing the completeness and quality of the observed data.
The results were stored the runs that minimized the global cost for each chain. The outcomes are represented in Figure E.VIII.3. After the runs, the parameter set was chosen that minimized the overall distance to the real data and used as an input for the interventions. Additionally, synthetic results were generated for a wider set of parameters to assess the model’s robustness in response to interventions, please see Intervention Strategies for further details.
Intervention Strategies
The study examined the impact of various law enforcement interventions on the dynamics of the criminal network through computational simulations. The intervention process was structured in three phases: warm-up, intervention, and post-intervention.
During the warm-up phase, lasting time steps, agents could interact globally, allowing the network to stabilize. At , we applied interventions with varying intensities, repeating them times to simulate scenarios ranging from isolated actions to sustained campaigns. Post-intervention, we restricted interactions to local connections, reflecting increased caution in criminal networks after law enforcement actions. This resulted in setting for the remaining steps.
We targeted agents based on network centrality measures: highest degree, closeness, betweenness, or lowest role assortativity. Three intervention types were implemented:
Reintegration: The targeted agent received up to n new random connections without changing their criminal state. This method explored how increased local connectivity might influence recidivism.
Arrests: The targeted agent was isolated from the network, simulating incarceration while maintaining their strategy.
Cooperation: The targeted agent’s state was changed from criminal to non-criminal. This approach assessed how individual changes impact network stability, with a focus on highly disassortative networks where the removal of a criminal actor could significantly disrupt criminal organizations.
In addition to the intervention performed on the model parameters that best match the data, we performed interventions on synthetic data with the same range as shown in Figure 5.3, Figure 5.4, Figure 5.5. In these simulations, the system consisted of agents and the number of potential roles was set to 4. The response to the interventions revealed a similar pattern to that of the real data (Figure E.VI.1, which implies that the model is robust to changes in the number of agents and roles.
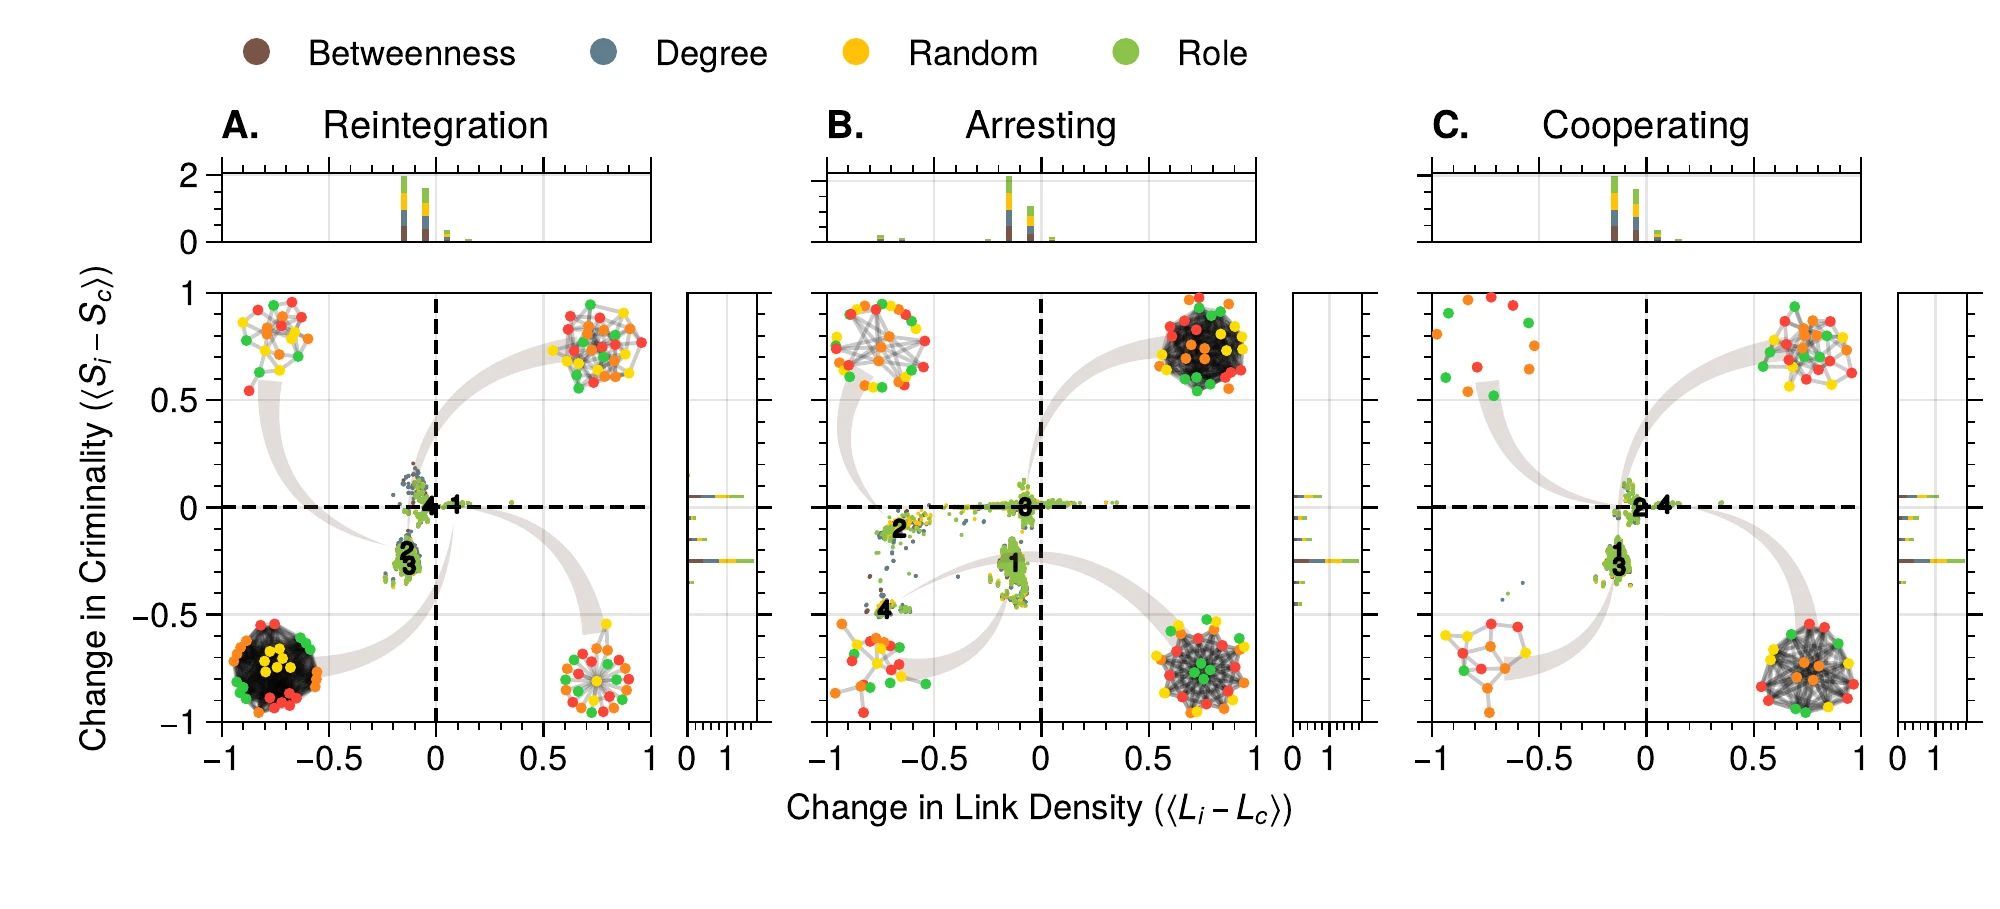
By applying these diverse intervention strategies and analyzing their effects on network structure and criminal activity, we aimed to provide insights into the complex dynamics of criminal networks under external pressures. This approach allows for a nuanced understanding of how different law enforcement strategies might reshape criminal landscapes, potentially informing more effective crime prevention policies.
Estimating Intervention Impact
Law enforcement aims to mitigate criminality. Interventions should ideally reduce the number of criminals in the network. However, results from computational interventions may in fact cause an increase in criminality rather than reduce it. In some cases, these effects may cause the system to approach a situation in which the system possesses all criminals. The response to interventions can be complex and non-monotonic - we may observe temporary spikes in criminal behavior before the system settles into a new equilibrium. Traditional metrics that focus on average effects or final outcomes may miss these potentially dangerous transient states. To capture these potentially transient extreme effects, we defined a set of metrics that measure the maximum deviation from pre-intervention behavior. First, we establish a baseline criminality level for each case by averaging the pre-intervention period from time to , where marks the start of the intervention: (E.6) For each time point after the intervention (), we calculate the deviation from this baseline for the link density and the average criminality. we then identify both the maximum positive deviation and the maximum negative deviation . To capture the worst-case scenario, we select whichever of these deviations has the larger absolute magnitude, denoted as . Finally, we normalize these effects by the largest absolute deviation observed across all cases , yielding . This normalized metric allows us to compare the relative severity of intervention effects across different scenarios, with values closer to indicating more extreme responses to the intervention. For the baseline, we used values from to avoid the transient effects of the initial conditions.
Data Description
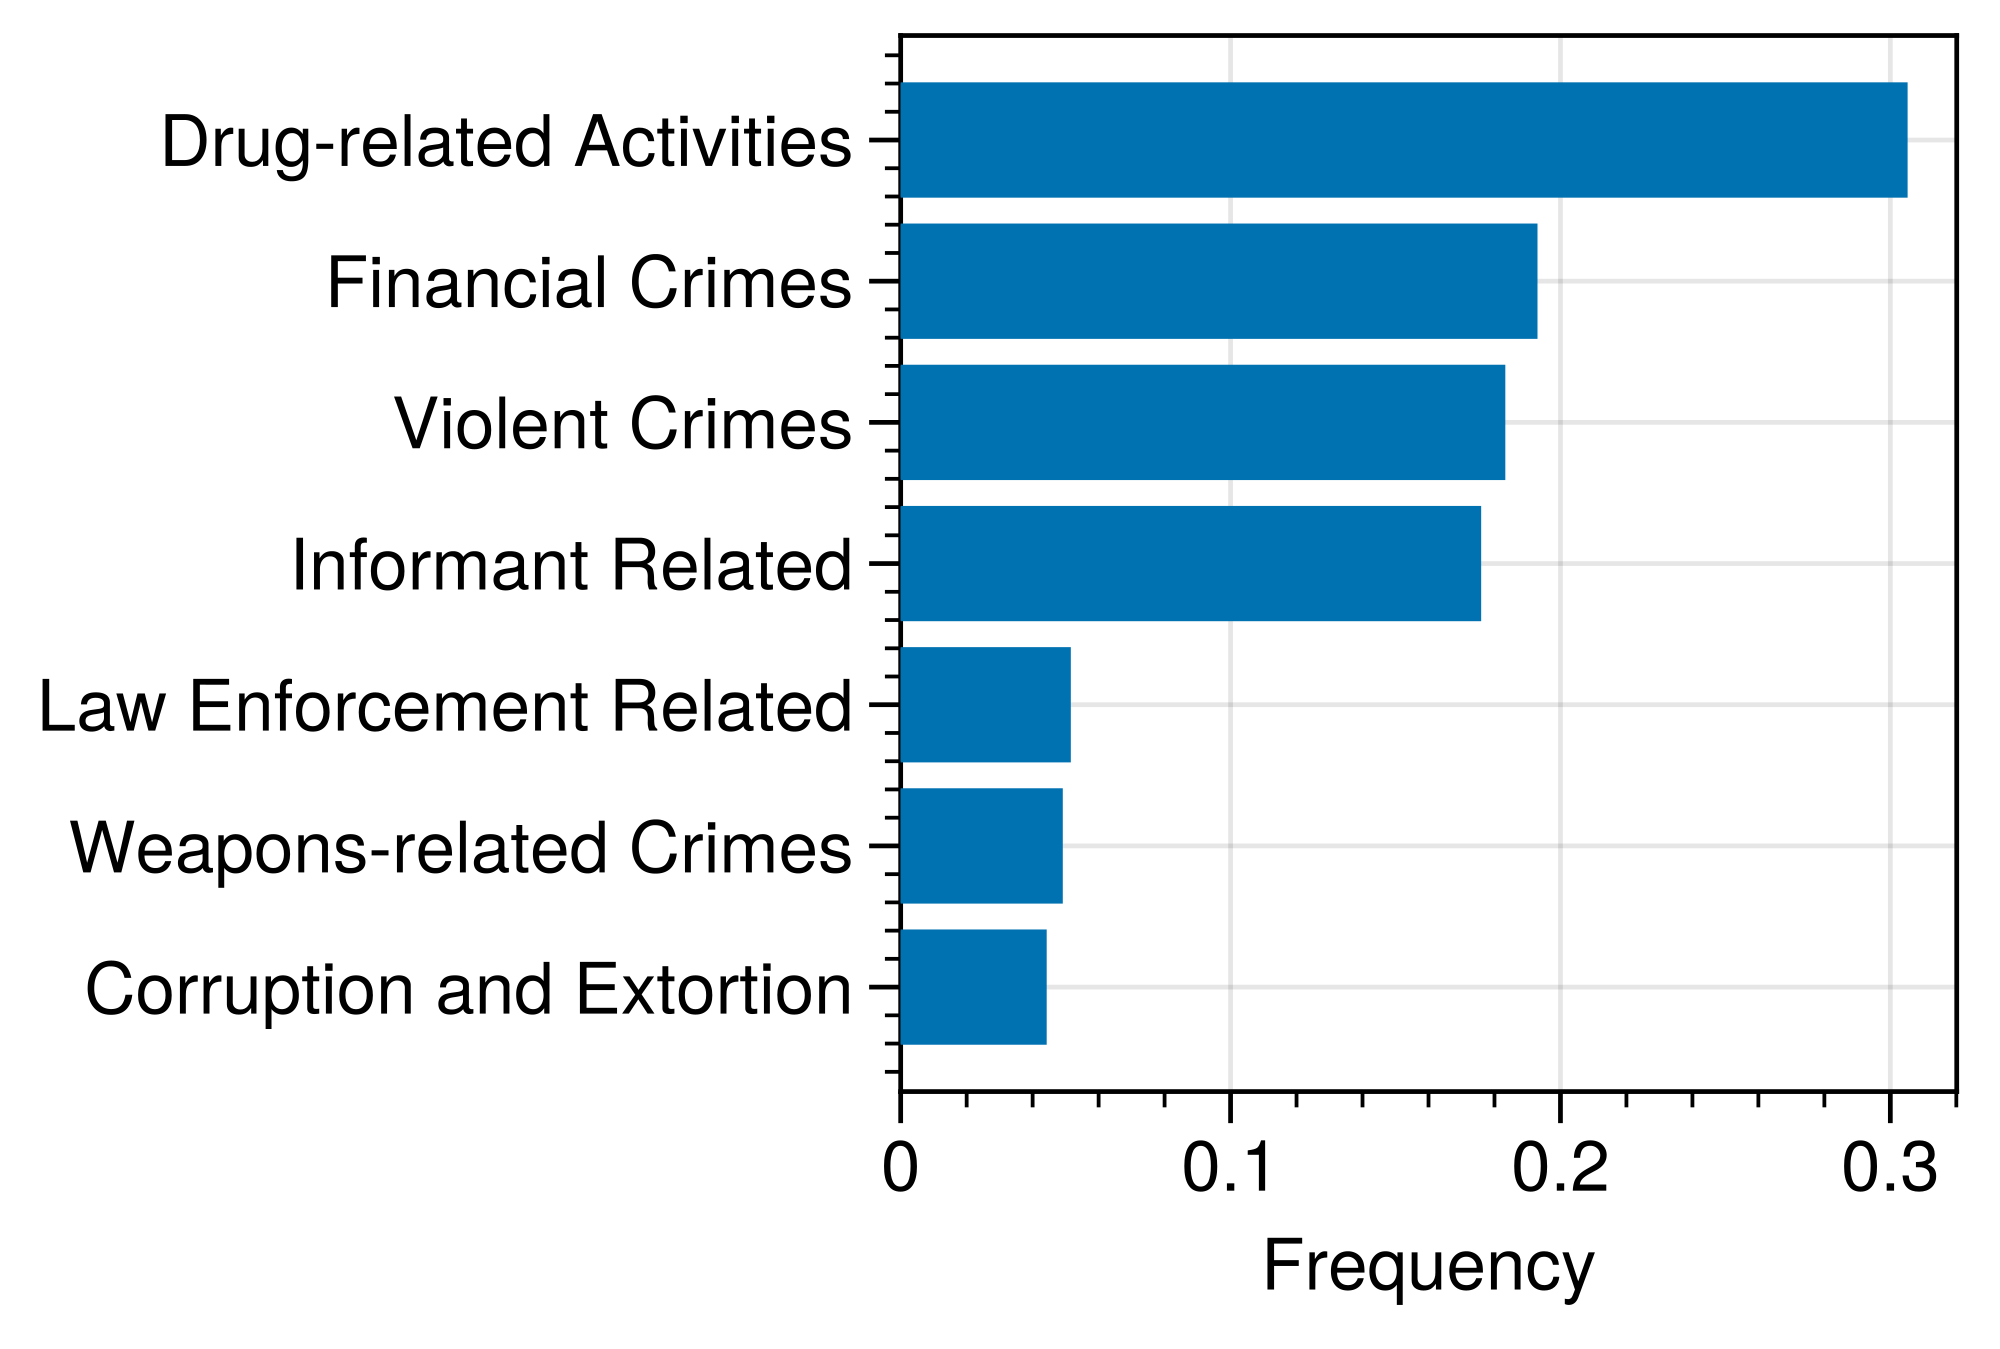
The dataset was provided by the Dutch National Police through an intelligence database system, which serves as a central repository for criminal intelligence information. The dataset contains information on pairwise connections between individuals sourced from criminal investigations: surveillance data, wiretap data, witness- and informant etc, considering individuals only when they occurred across multiple independent sources to ensure reliability. All data is anonymized and no details were provided.
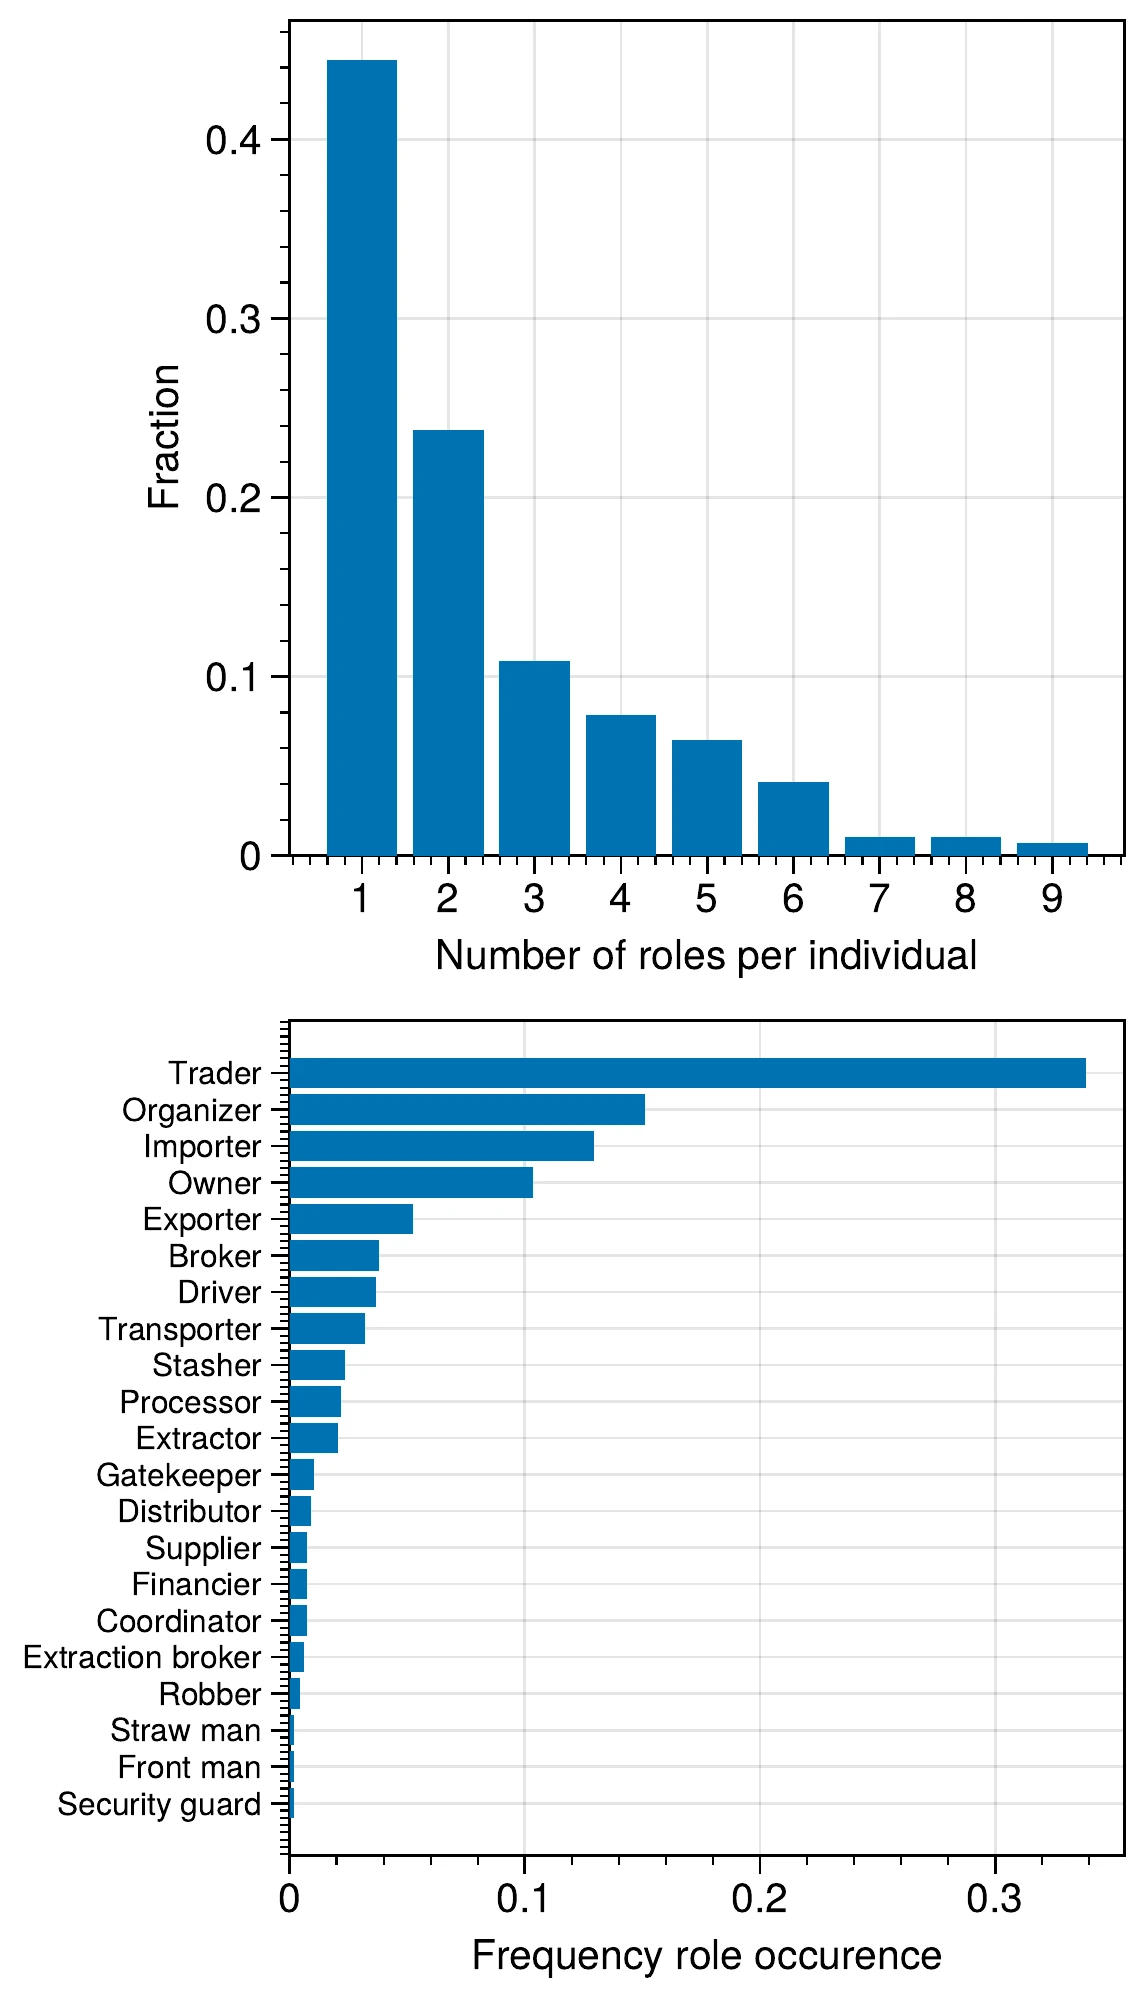
The data spans from 2009 to 2023, with anonymized identifiers and detailed information regarding the roles and activities of individuals in various criminal markets (Figure 5.1, Figure E.VII.1). Data from multiple database sources were combined to provide a cohesive overview of criminal actors in the Netherlands. The database integrates information from multiple law enforcement agencies, including regional police units, the national police, and specialized investigation services.
In total, 20 distinct criminal roles were identified within the network. Each individual could possess up to 9 roles simultaneously, resulting in 99 unique role combinations observed in the data. To ensure data quality, actors with unknown roles were removed from the analysis, reducing the dataset from 8995 entries to 603 entries. The final analyzed network consists of 295 individuals connected by 603 edges (see Figure 5.1), representing verified criminal collaborations. The dataset was provided by the Dutch National Police. The dataset contains information on pairwise connections between individuals sourced based on police intelligence, considering individuals only when they occurred in the joint of different sources.
The Zoo of Synthetically Generated Criminal Networks
To support the results in the main text, we performed simulations on synthetic data to see how the results generalize. In the main tex we explore how the properties from a real-world network produces a rich set of behavior. To see if this dependency holds for other starting forms, computational experiments were performed on synthetic data with agents and roles equally occordingly ( for ). Simulations were performed on from four distinct scenarios where the agents were all criminal (or not) or all connected (or not). The results show that the system dynamics are mainly determined by the external conditions of cost-to-benefit ratio and decision error. The rewiring rate was set to unless otherwise stated.
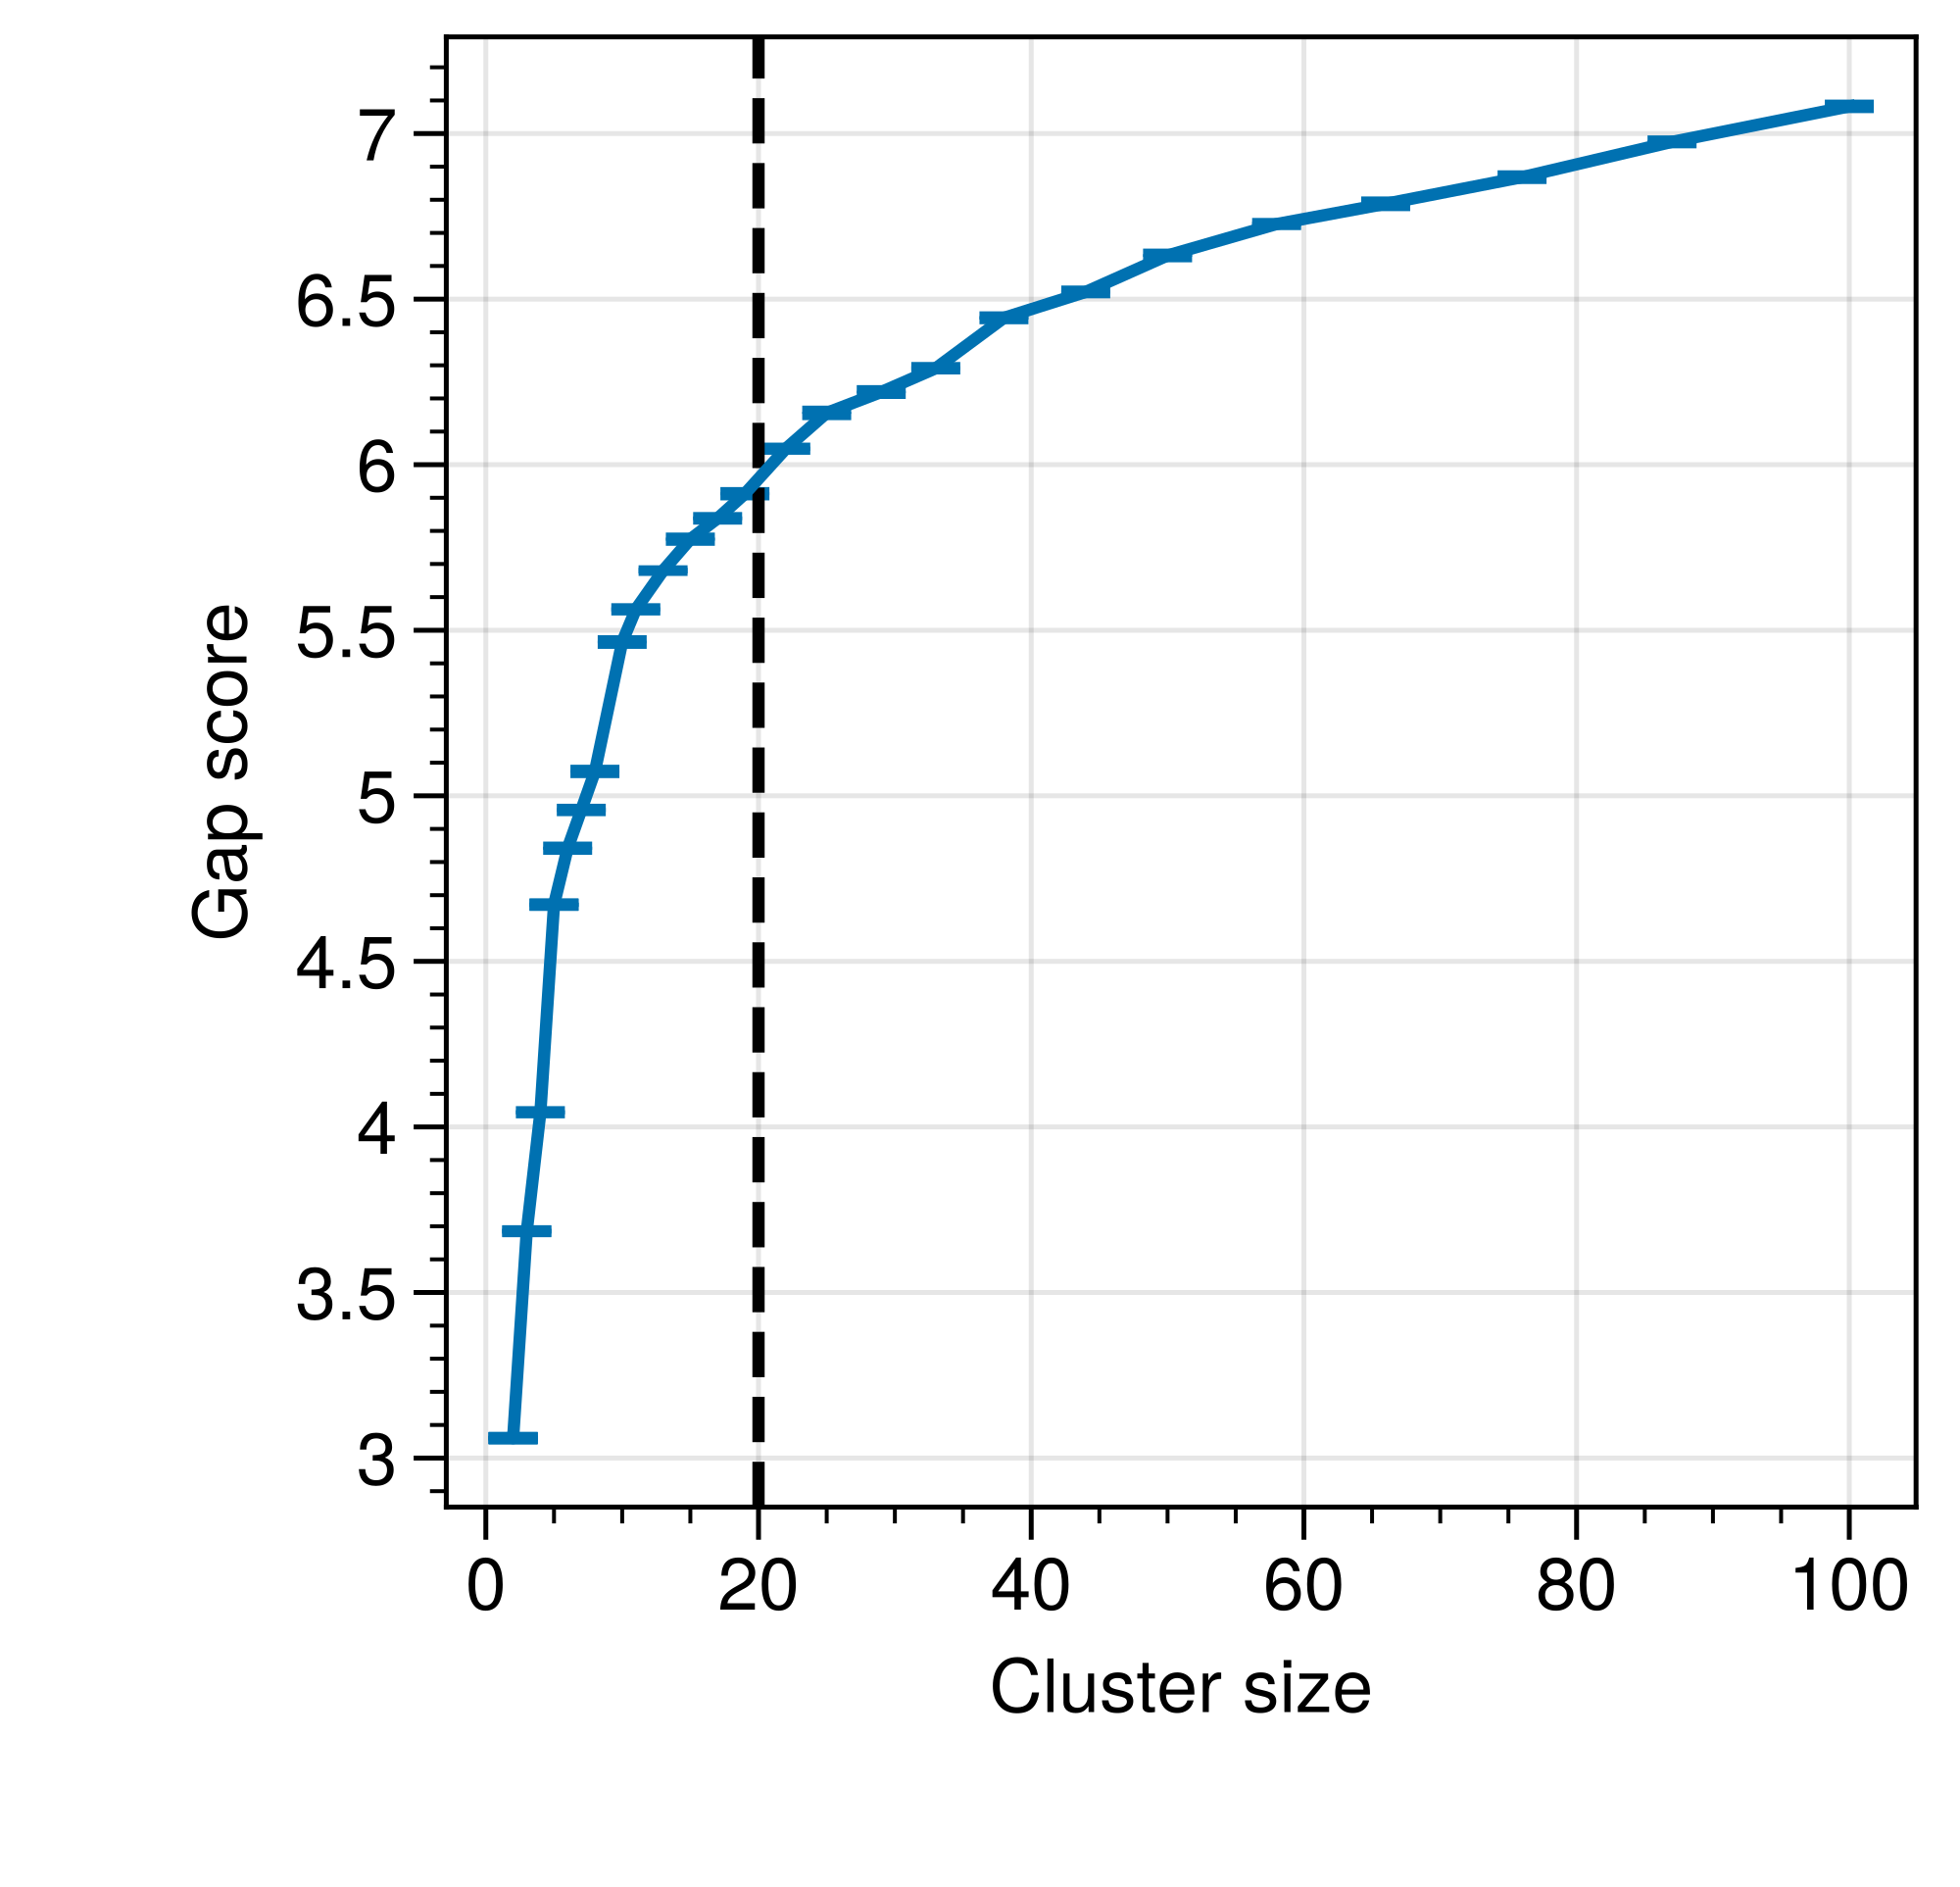
To show the richness of the proposed generator for criminal collaboration, clustering was performed on synthetic data with agents. Model comparison revealed that the optimal clustering was achieved for clusters with a gap score of (Figure E.VIII.1). In total 40 reference distributions were used to create the gap scores. The results are created by simulating the system for time steps on a grid of , and . The shape of the networks are determined through these exterminal conditions, see main text for further details. Note that our point is not to extract the exact number of clusters, but to show the variety of potential criminal organizations. As such it could be argued that a higher number of clusters could have been chosen as the gap score increases past clusters.
The bandwidth of potential graphs show a full range from densely connected, decentralized, to a scale-free-like structure of sparse connectivity but some nodes having a high degree.
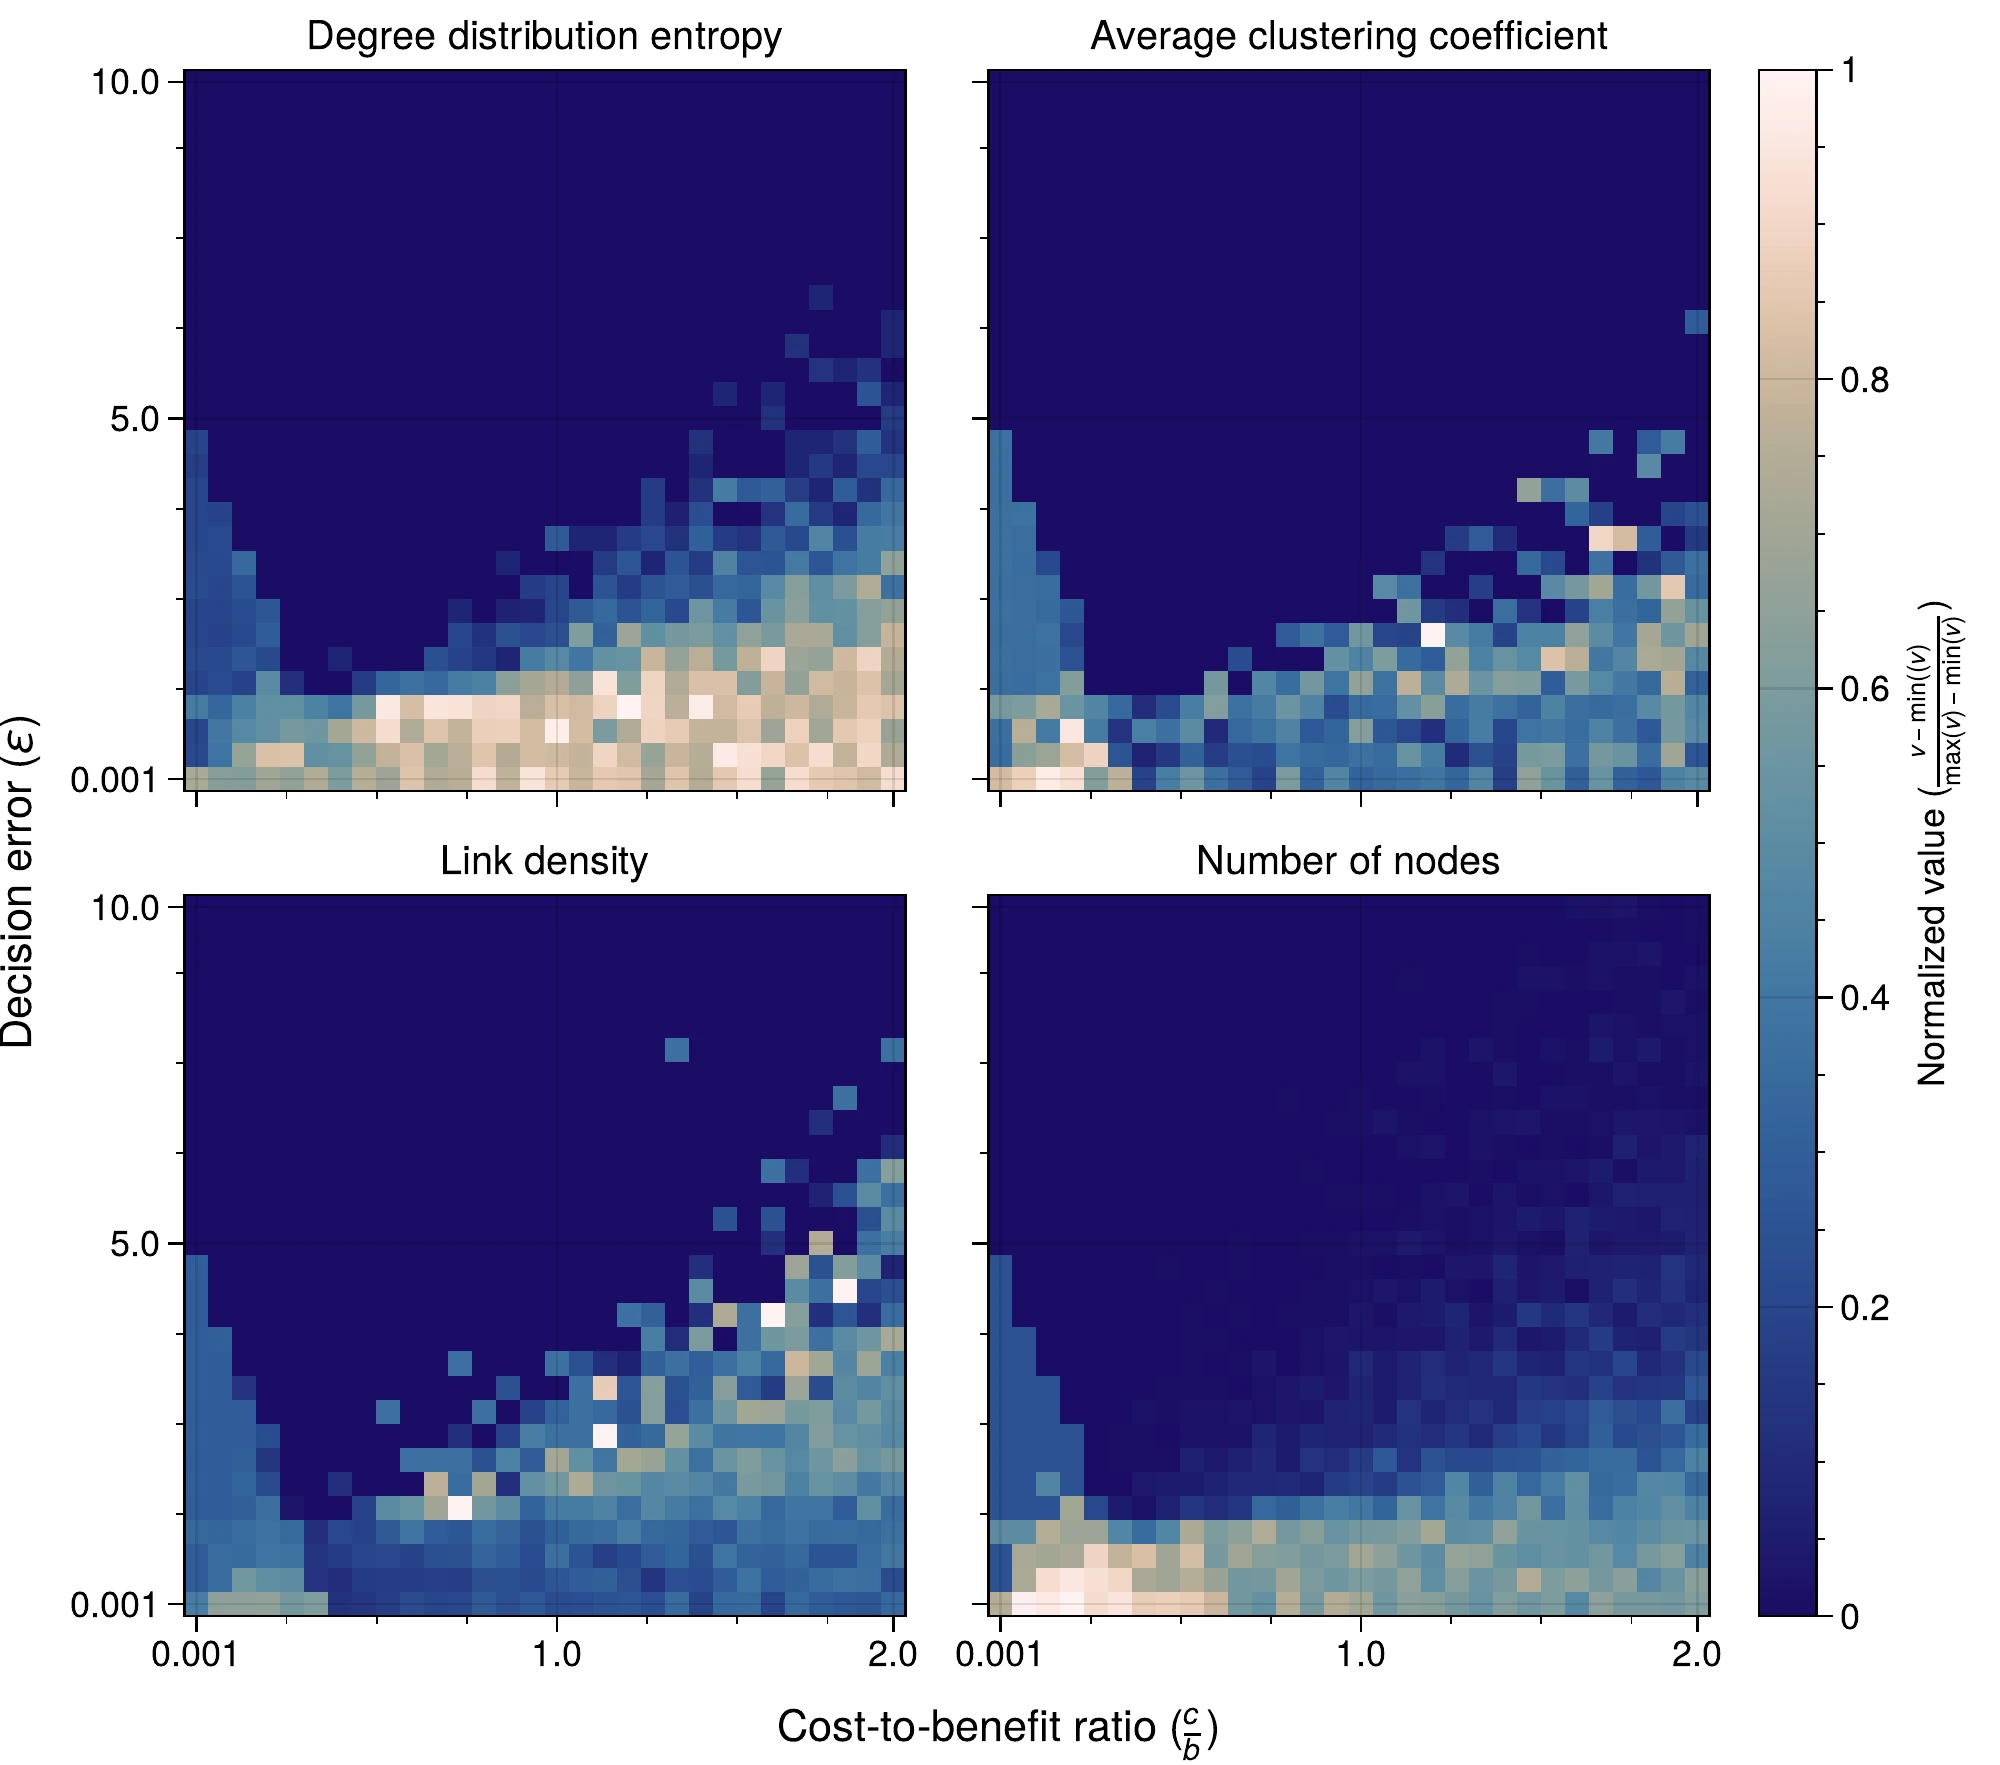
The large varietey of potential criminal organizations structures is reflected in the diverse range of centrality measures. To capture the variety, we show in Figure E.VIII.2 the normalized values for the entropy of the degree distrbution, the average clustering coefficient, link density and number of nodes. The results show that the size of the organization negatively correlates with cost; higher cost reduces the number of members in a criminal organization. The increasing cost, however, increases the variety in the degree distribution. Together with Figure 5.3, Figure 5.4, Figure 5.5, we can see how the increase in entropy of the degree distribution shifts focus from a decentralized graph to one in which a few nodes have a high degree. This is furhter strengthened by the decrease in clustering coefficient – lacking short cycles.